 (Click on the figure to
get a bigger version)
(Click on the figure to
get a bigger version)
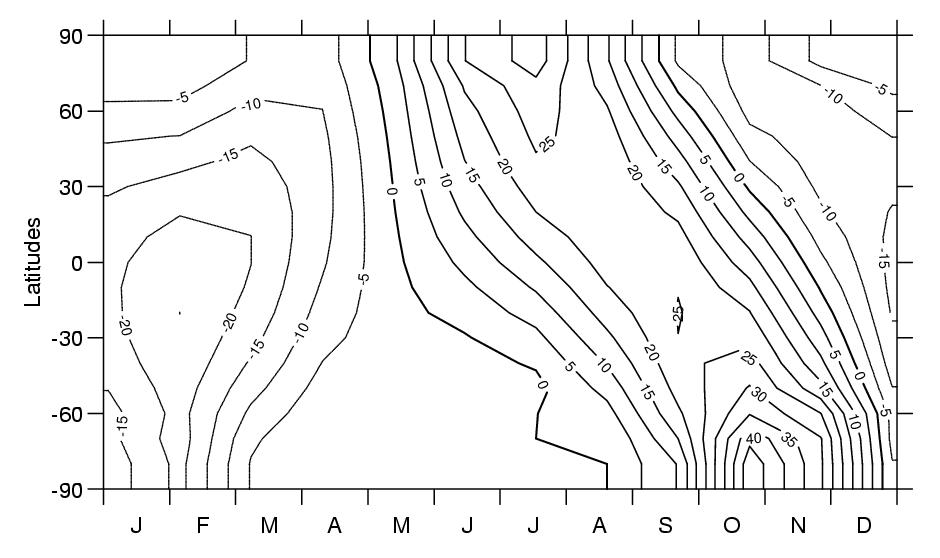
Figure 1. Insolation changes at 6000 year BP : latitude-month
distribution of the changes in incoming solar radiation at the top of
the atmosphere. Isolines at every 5 W/m2.
Atmospheric general circulation models (AGCMs) are continually improving in their ability to simulate the major features of today´s climate. Many of these models are being used to predict future climate change and although there is broad agreement among the models, there are also many differences in the details of their predictions. In order to determine whether models can simulate climatic conditions much different from today, the models can be used to simulate paleoclimates, and paleodata can be used to evaluate the results. Moreover, AGCMs have proved their usefulness to investigate mechanisms of past climate changes (e.g., Joussaume, 1999)). The Paleoclimate Modeling Intercomparison Project (PMIP) was initiated in order to coordinate and encourage the systematic study of AGCMs and to assess their ability to simulate large changes of climate such as those that occurred in the distant past. It also is serving to encourage the preparation of global reconstructions of paleoclimates that can be used to evaluate climate models.
The PMIP effort developed out of a NATO Advanced Research Workshop, convened in 1991, which led to a cooperative and coordinated effort to compare model simulations with paleoclimate data. The workshop participants agreed to focus initially on two specific periods in the past : the last glacial maximum, 21 000 years before present (BP), and the mid-Holocene climate, 6 000 years BP, which correspond to extreme conditions that are relatively well documented. Simulating the last glacial maximum provides an opportunity for assessing the models´ ability to simulate extreme cold conditions as well as for studying the feedbacks associated with both a decrease of the atmospheric CO2 concentration and ice sheet elevation of 2 to 3 km above North America and northern Europe. The simulation of the mid-Holocene conditions is on the other hand a sensitivity experiment in which the seasonal contrast of incoming solar radiation at the top of the atmosphere is changed; 6000 years BP, the seasonal contrast was larger in the northern summer, leading to an increase of summer monsoons over Africa and South Asia.
This international project, coordinated by the authors involves about 18 modeling groups (USA, Canada, UK, Germany, France, Australia, Japan and Korea) (Joussaume and Taylor, 1995). This project is endorsed by both the International Geosphere Biosphere Project (under PAst Global ChangES) and the World Climate Research Program (within the Working Group on Coupled Models) and its aims are to evaluate climate models under paleoclimate conditions and improve our understanding of past climate. Following an initial phase during which boundary conditions were defined and simulations were completed, the PMIP participants have met every two years since 1995 in order to discuss the results. These workshops have fostered cooperation and forged collaborations among groups working on the two PMIP periods. Discussions at the workshops were not limited to the PMIP experiments themselves, but also to the many complementary numerical experiments performed for the mid Holocene and last glacial maximum climatic periods. This has helped to enhance our knowledge as is reflected within this report of the third PMIP workshop.
Three PMIP experiments have been defined : one for the mid Holocene, 6000 years BP, and two experiments for the last glacial maximum (LGM), 21 000 years BP (18 000 radiocarbon date (Bard, et al., 1990)), either with atmosphere alone models or with atmosphere models coupled to surface ocean models. A summary of all the PMIP experiment boundary conditions is described in Table 1 and is detailed below. The boundary condition datasets are archived at the National Geophysical Data Center (NGDC) in Boulder (Colorado).
Table 1 : PMIP experimental design. Description of the boundary conditions used in the three PMIP experiments. Only changes in the forcing was prescribed but optional boundary conditions were available for the control run (modern climate) if necessary.
| Boundary conditions | Modern | 6 kyr BP | 21 kyr BP | |
|---|---|---|---|---|
| Sea surface temperature and sea ice cover |
Control run or PMIP dataset | No change | Computed | CLIMAP (1981) |
| Albedo (land-ice free) |
Control run | No change | No change | |
| Ice sheets | Control run | No change | Updated ice sheets (Peltier, 1994) | |
| Topography, coastlines | Control run | No change | -105 m | |
| CO2 | 345 ppm or control run : Ccont |
280 ppm or (280/345) * Ccont |
200 ppm or (200/280) * Ccont |
200 ppm or (200/345) * Ccont |
| Insolation | So : control run or 1365 W.m-2 | So, no change | So, no change | |
| Orbital parameters | ||||
| Eccentricity 0.016724 |
0.018682 | 0.018994 | ||
| Axial tilt 23.446 |
24.105 | 22.949 | ||
| Angular precession 102.04 |
0.87 | 114.42 | ||
| Seasonal cycle | Yes At least 10 yrs |
Yes At least 10 yrs |
Yes At least 20 yrs |
Yes At least 10 yrs |
At 6000 years BP, the main change in incoming solar radiation is due to the displacement of the longitude of perihelion whereas the other orbital parameters are only weakly affected (Table 1) (Berger, 1978). The orbital configuration then intensifies (weakens) the seasonal distribution of the incoming solar radiation in the northern (southern) hemisphere, by about 5% (Figure 1). Although the insolation forcing is not maximum at 6000 years BP, this period was preferred to earlier Holocene periods since it it is not biased by any remnant ice sheets of the last glaciation. The CO2 concentration was prescribed at its pre-industrial value of 280 ppm (Raynaud, et al., 1993). However, the impact of such changes of CO2 is weak since sea surface temperatures (SST) are fixed in these simulations.
(Click on the figure to
get a bigger version)
Figure 1. Insolation changes at 6000 year BP : latitude-month
distribution of the changes in incoming solar radiation at the top of
the atmosphere. Isolines at every 5 W/m2.
Indeed, SSTs were prescribed to be the same as present-day. Except at high northern latitudes and a few coastal regions, the apparent differences in SST between 6 ka BP and today are small and within the errors associated with current reconstruction methods (Ruddiman and Mix, 1993) (Koc Karpuz and Schrader, 1990). Although pollen data record important vegetation changes especially in monsoon regions (e.g., (Jolly, et al., 1998)), in PMIP the land-surface characteristics were also constant, i.e. vegetation changes were not accounted for, because a global reconstruction of mid-Holocene vegetation was unavailable and coupled atmosphere-vegetation models were also not yet available. The PMIP mid-Holocene experiment therefore can not be expected to yield complete agreement with paleodata because the experimental design was simplified in order to isolate particular aspects of the model response. The PMIP experiments have been complemented more recently by sensitivity experiments as well as coupled model experiments designed to investigate the impact of ocean and vegetation feedbacks. PMIP simulations should therefore be strictly interpreted as sensitivity experiments to changes in insolation forcing and are better suited for model intercomparison than for detailed comparison with paleodata.
In order to allow for internal variability, models have been run for at leat 10 years and model results averaged over at least 10 years. Changes in the Earth´s orbital parameters also requires a careful definition of the seasons (Joussaume and Braconnot, 1997). In the PMIP experiments, March 21 was used as the date of the vernal equinox but the season definition was kept as present since changes in the length of the seasons remain small at 6000 year BP and since models are forced by present day SSTs (Joussaume and Braconnot, 1997).
Within PMIP, a new set of boundary conditions was prepared to simulate the LGM climate. An update of the ice sheet extent and height was provided by (Peltier, 1994) (Figure 2a). It is 1000 meter lower than the previous (CLIMAP, 1981)´s reconstruction over the Laurentide and fennoscandian ice sheets. The atmospheric CO2 concentration was prescribed to be 200 ppm as inferred from Antarctic ice cores (Raynaud, et al., 1993) (compared to a modern pre-industrial level of 280 ppm). Earth´s orbital parameters were changed according to their values at 21000 years BP (Table 1), but the insolation changes were in fact small for this time period.
 (Click on the
figure to get a bigger version)
(Click on the
figure to get a bigger version)
Figure 2a. LGM boundary conditions : ice sheet height changes
as estimated from (Peltier, 1994). Isolines at every 600 meters.
Over the oceans, two sets of experiments were defined: one with SST changes prescribed from estimates given by (CLIMAP, 1981) (Figure 2b), the other with SSTs computed using coupled atmosphere-mixed layer ocean models and assuming no change in the ocean heat transport. Each approach has its advantages and caveats : 1) precribing SSTs should yield a better model-data comparison over land and should facilitate evaluation of the atmospheric models; however, such simulations are strongly dependent on SST estimates which are still subject to substantial uncertainty ; 2) computing SSTs permits an evaluation of one kind of model used for future climate prediction (e.g. 2xCO2 sensitivity experiments) but does not account for any changes in the oceanic heat transport, in contradiction to evidence for thermohaline circulation changes (Duplessy, et al., 1988).
 (Click on the
figure to get a bigger version)
(Click on the
figure to get a bigger version)
Figure 2b. LGM boundary conditions (continued) : changes in
sea surface temperatures and sea ice extent as estimated by (CLIMAP,
1981) for February ('winter') and August ('summer'). Isolines at -8,
-6, -4, -2, -1, 0, 1, 2°C. Glacial sea-ice extent shaded.
In the experiments with computed sea surface temperature, the CO2 concentration for the control run has been defined corresponding to pre-industrial levels in order to better compare model results and paleoreconstructions. Indeed, the current climate and certainly the modern pollen and plankton have not yet come into equilbrium with the recent rapid rise in CO2 (345 ppm). Moreover, "modern" plankton in ocean core tops are subject to bioturbation and may represent a century or several-century average, and modern pollen data may also represent a time average and in addition must be corrected to remove the effects of human disturbances.
Most simulations have now been completed by the PMIP modeling groups and have been stored at PCMDI [2007 note: simulations are now stored at LSCE...]. A list of the simulations available is shown in Table 2. Model-model and model-data comparisons have mainly been conducted within subprojects led by a scientific coordinator. These subprojects deal with :
Table 2 : List of the PMIP simulations. Model designation, horizontal and vertical resolution (spectral modes or latitude x longitude number of grid points, and number of levels, L). Model descriptions can be found on the web at http://pmip.lsce.ipsl.fr/. An 'X' indicates output which is archived and available. Data base version of 01/12/98 is used for all figures.
| Model designation | Resolution Version |
6000 yr BP | LGM CLIMAP | LGM computed | ||
|---|---|---|---|---|---|---|
| 1 | BMRC | Bureau of Meteorology Research Centre (Australia) | R21, L9 V. 3.3 |
X | ||
| 2 | CCC2 | Canadian Centre for Climate Modelling and Analysis (Canada) | T32, L10 V. 2 |
X | X | X |
| 3 | CCM3 | NCAR Climate Community Model (USA), run at CCR | T42, L18 V. 3 |
X | ||
| CCM1 | R15, L12 V. 1 |
X | ||||
| 4 | CCSR1 | Center for Climate System Research (Japan) | T21, L20 V. 5.4.02 |
X | X | |
| 5 | CNRM2 | Centre National de Recherches Météorologiques (France) | T31, L19 V. 2 |
X | ||
| 6 | CSIRO | Common wealth Scientific and Industrial Research Organisation (Australia) | R21, L9 V. 4-7 |
X | ||
| 7 | ECHAM3 | Max-Planck Institut for Meteorology (Germany), run at Bremen Univ. | T42, L19 V. 3.6 |
X | X | |
| 8 | GEN2 | National Center for Atmospheric Research (USA) GENESIS model, run at NCAR | T31, L18 V. 2 |
X | X | X |
| GEN1 | run at LLNL | R15, L12 V. 1 |
X | |||
| 9 | GFDL | Geophysical Fluid Dynamics Laboratory (USA) | R30, L20 | X | X | |
| 10 | GISS | Goddard Institute for Space Studies (USA) | 72*46, L9 V. II prime |
X | ||
| 11 | LMD4 | Laboratoire de Météorologie Dynamique (France), run at LSCE | 48*36, L11 V. 4ter |
X | X | X |
| 12 | LMD5 | 64*50, L11 V. 5.3 |
X | X | ||
| 13 | MRI2 | Meteorological Research Institute (Japan) | 72*46, L15 V. II.b |
X | X | X |
| 14 | MSU | Moscow State University (Russia) | 10x15, L3 | X | X | |
| 15 | UGAMP | UK Universities Global Atmospheric Modelling Programme (UK) | T42, L19 V. 2 |
X | X | X |
| 16 | UIUC11 | University of Illinois at Urbana-Champaign (USA) | 72*46, L11 | X | ||
| 17 | UKMO | UK Meteorological Office Unified Model (UK) | 96*73, L19 V. 3.2 |
X | X | |
| 18 | YONU | Yonseï University (Korea) | 72*46, L8 Tr7.1.1 |
X | ||
PMIP has also fostered the development of proxy-datasets as well as model-data comparisons at 6000 and 21000 years BP through a model-data subcommittee with the following members : S. Harrison, J. Guiot and P. Bartlein, with the help of D. Jolly, A. de Vernal and S. Kroepelin. An important effort has been devoted to improve the methodologies used for model-data comparisons, such as the use of bioclimatic parameters or the use of forward methods (e.g., (Kohfeld and Harrison, in press)).
A large set of PMIP studies are now nearing completion and are reported within this book. We present here the general conclusions of these studies and discuss some complementary experiments that provide a more complete overview of paleoclimatic simulations for the two PMIP time slices.
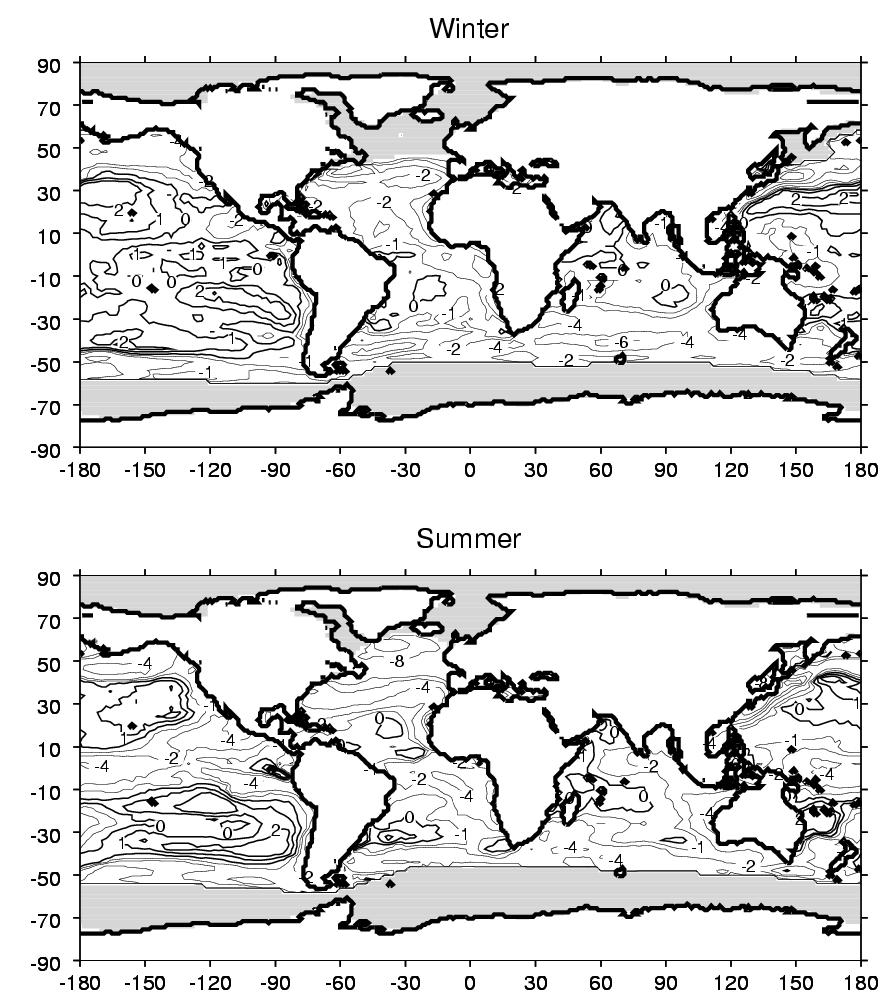
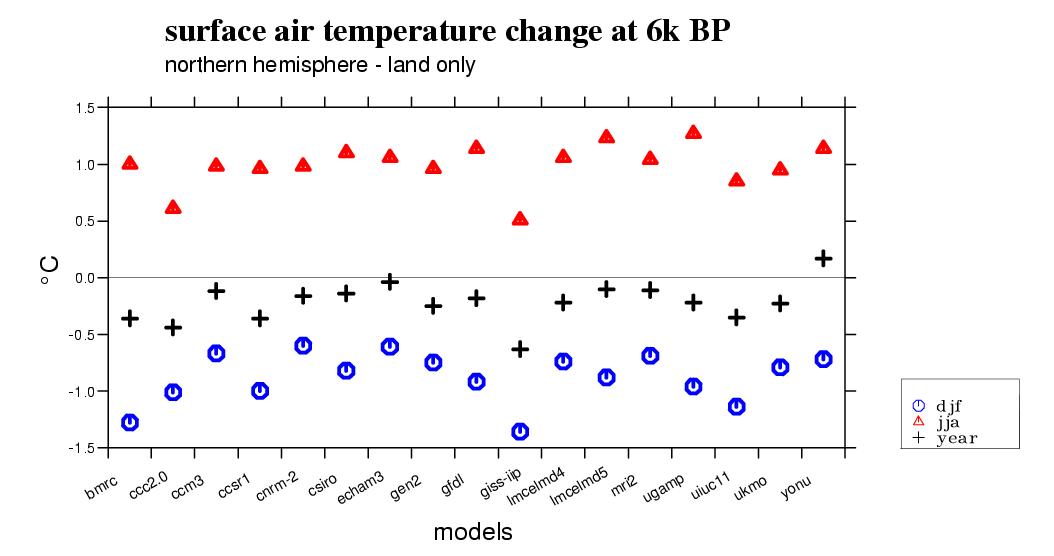
Within PMIP, 18 different climate models with different resolutions and parameterizations have been run under the same conditions (Table 2) (Joussaume, et al., 1999). Following the insolation forcing, all models simulate an increased seasonal cycle of temperature over the continents of the northern hemisphere, reaching about ±1°C on global average for the winter/summer seasons (Figure 3). The summer warming reaches a maximum between 40°N and 50°N with more than 2°C, whereas the cooling occurs further south, between 0°N and 30°N, with a similar magnitude (Figure 4). Thus, the amplification of the seasonal cycle is maximum within 0 and 30°N, as is insolation. In summer, all the models simulate a warming over Eurasia and an increase of the African and Asian monsoon rains, marked by a northward expansion of rains. They all confirm the mechanism proposed in earlier experiments (see for example results from individual PMIP simulations (Dong, et al., 1996; Hall and Valdes, 1997; Hewitt and Mitchell, 1996; Lorenz, et al., 1996; Masson and Joussaume, 1997)): a summer warming of the Eurasian continent, a deepening of the continental summer low and an increased penetration of rain. Nevertheless, models exhibit differences in the amplitude and spatial patterns of the simulated changes (Braconnot, et al., subm.; Joussaume, et al., 1999) and (see report from P. Braconnot, this volume).
 (Click on the figure to
get a bigger version)
(Click on the figure to
get a bigger version)
Figure 3. Global temperature changes at 6000 year BP as
simulated by the PMIP models. Changes in annual mean (crosses),
June-July-August (JJA) (triangles) and December-January-February
(dots) temperatures. NB: in this figure, the GISS model results are
still from the 06/03/98 database version.
 (Click on the figure to
get a bigger version)
(Click on the figure to
get a bigger version)
Figure 4. Winter (DJF) and summer changes (JJA) in a) surface air
temperature and b) precipitation, averaged for the 17 PMIP simulations
(excluding MSU). Isolines at ±0.25, ±0.5, and then at
every 0.5°C with grey shading above 1°C. Isolines
±0.25, ±0.5, ±1, ±2 mm/day with grey
shading above 0.5 mm/day for precipitation changes.
Model-data comparisons have been documented over several regions of the globe based on pollen data and lake level estimates. They show that :
PMIP experiments therefore tend to underestimate several prominent features of the mid Holocene. This may in great part result from the limitations of the experimental design (i.e. no change over the oceans and no change in vegetal cover, inhibiting the ocean and vegetation feedbacks).
PMIP has spurred several sensitivity experiments as well as coupled experiments that were discussed at the PMIP workshops. These experiments for the mid-Holocene have demonstrated:
All these results show that future model comparisons for the Holocene should consider coupled atmosphere-ocean experiments including vegetation feedbacks. First comparisons of the existing coupled atmosphere-ocean simulations are presented in Braconnot et al. (this volume).
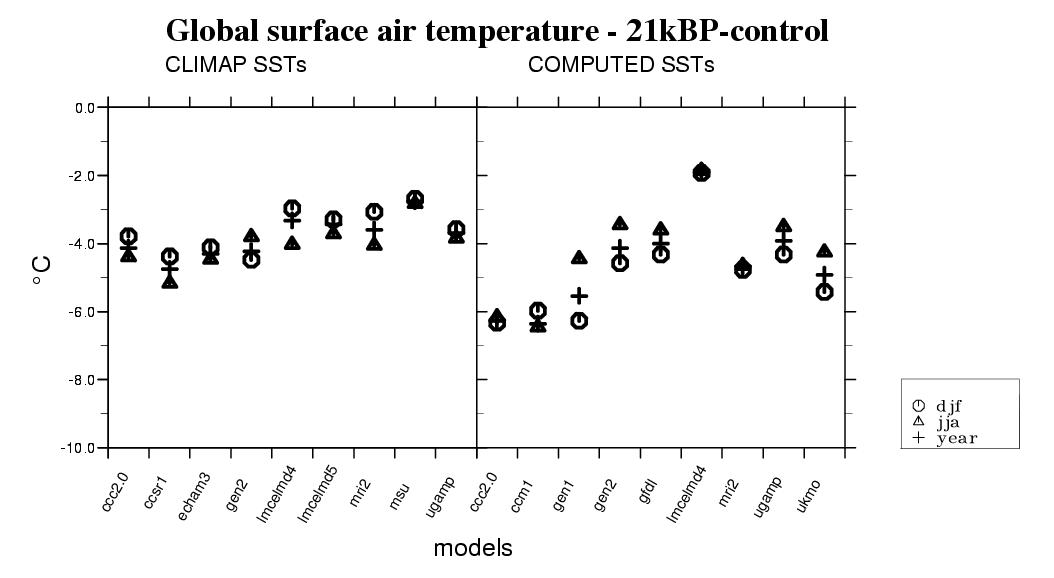
An annual mean global cooling of about 4°C is obtained by all the models forced by the CLIMAP SST estimates (Figure 5). This cooling is not uniform: it is stronger in the northern hemisphere, over and near the ice sheets, and stronger over land than over oceans due to the weaker heat capacity of soil and the snow albedo feedback over land (Figure 6). The strongest cooling occurs over the North Atlantic but with an amplitude which is model-dependent. For example, (Masson, et al., 1998) showed an important impact of the parameterization of surface fluxes on the intensity of the atmospheric cooling over sea ice : in one model (LMD4), surface fluxes do not depend on surface stability and even in the very cold conditions of the LGM, the atmosphere is cooled down by a transfer of heat from the atmosphere to sea ice, in contrast to the other model (LMD5) for which heat transfers are inhibited by strong vertical stability conditions. As a result, the winter atmospheric cooling differs between the two models, LMD5 being 15°C warmer than LMD4.
 (Click on the figure to
get a bigger version)
(Click on the figure to
get a bigger version)
Figure 5. Annual mean global cooling simulated for the LGM by the PMIP
models : (on the left) simulations forced by CLIMAP SSTs, (on the
right) simulations with coupled atmosphere-mixed layer ocean models.
The range of cooling is larger when using computed SSTs, from -6°C to -2°C (Figure 5), since models are no longer constrained by the same change in SST. Such differences arise from both differences in the simulated forcing at the LGM, mainly due to differences in the surface albedo, as well as differences in the simulated climate sensitivity (see Taylor this volume), consistent with 2xCO2 experiments (IPCC, 1996).
Compared to the fixed SST experiments, computed SST experiments produce a greater inter-hemispheric difference with a weaker cooling in the southern hemisphere due to less sea ice extent than prescribed by CLIMAP (Figure 6). In the tropics, computed SSTs are colder than CLIMAP, especially over the tropical Pacific where the warm pools of CLIMAP are not reproduced (Pinot, et al., 1999). Nevertheless, for some models run for both fixed and computed SSTs, such as UGAMP and GEN2, the annual mean change in temperature remains very similar on global average, although regional differences can be substantial (e.g., (Dong and Valdes, 1998)).
 (Click on the figure to
get a bigger version)
(Click on the figure to
get a bigger version)
Figure 6. Annual mean changes in surface air temperature at the
LGM. Average of all the PMIP simulations interpolated to the same
grid : (top) the 7 simulations using CLIMAP SSTs (the MSU model has
been excluded due to its coarse resolution), (bottom) for the 8
simulations using computed SSTs. Fields represent the LGM minus
present-day values. Isolines at -20, -14, -8, -6, -4, -2, -1, 0,
1. Dark grey above 1°C and light grey below -20°C.
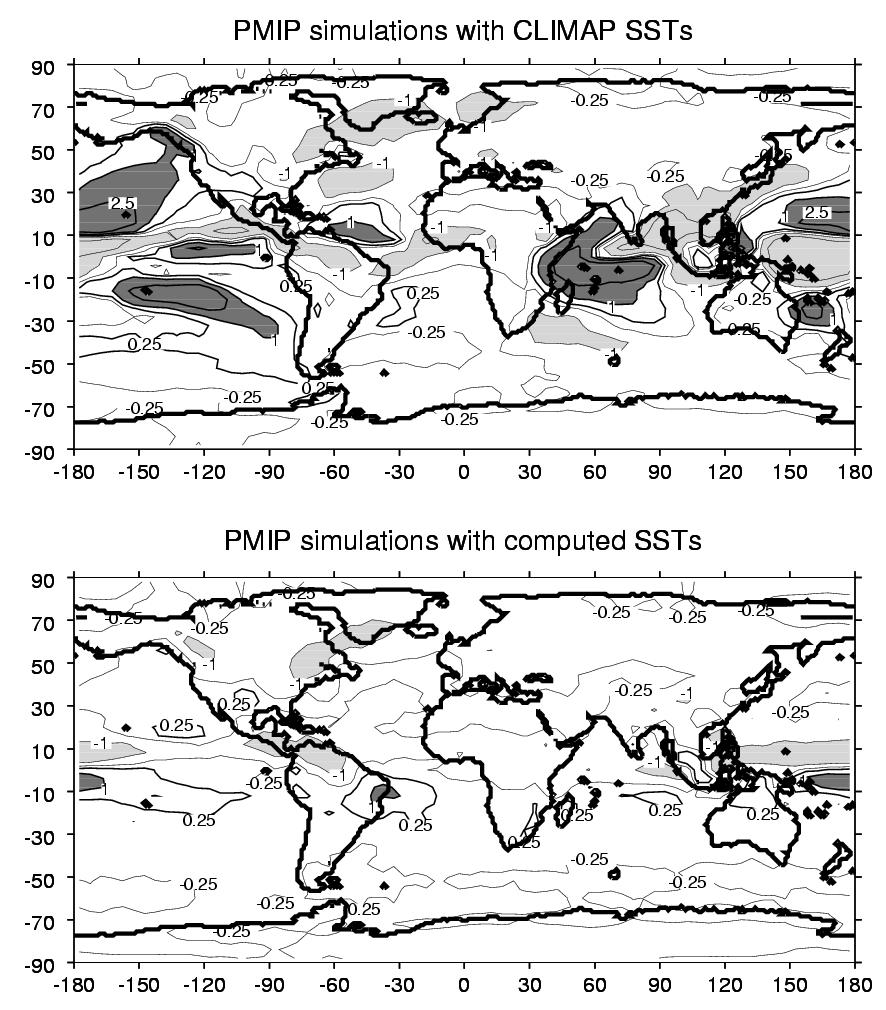
According to both sets of PMIP simulations the LGM climate is also more arid over most of the northern continents and in the tropics (Figure 7). Larger precipitation however occurs over tropical oceans, especially over the warmer pools of CLIMAP SSTs. Much smaller changes are found over tropical oceans when computing SSTs since the models simulate colder ocean temperatures than CLIMAP. At the regional scale, the simulations are characterised by a number of common features, including a reduction in the strength of the Afro-Asian monsoon (Braconnot, et al., subm.) and increased intertropical aridity, corroborated by various paleoindicators.
 (Click on the figure to
get a bigger version)
(Click on the figure to
get a bigger version)
Figure 7. Same as figure 6 for annual mean changes in
precipitation. Isolines at ±0.25, ±1, ±2.5
mm/day. Dark grey for an increase of precipitation above 1 mm/day,
light grey for a decrease in precipitation, below -1 mm/day.
Following the debate on tropical cooling raised by (Rind and Peteet, 1985), a detailed model- data comparison has been conducted for the tropics at the LGM (see Ramstein, this volume). Thanks to a new synthesis effort fostered by PMIP (Farreira, et al., 1999), (Pinot, et al., 1999) show that 1) all the simulations using the relatively warm tropical sea surface temperatures given by (CLIMAP, 1981) tend to be too warm over land, except over equatorial Africa, 2) models computing sea surface temperatures with a slab ocean show a range of terrestrial cooling strongly related to the intensity of the tropical ocean cooling. Some models produce a strong terrestrial cooling, but this is associated with cooling that is too large to be consistent with recent alkenone data. However, one model gives reasonable results over both land and oceans.
Over mid-latitudes, the atmospheric circulation is strongly affected by the glacial ice sheets. An anticyclonic circulation is forced over the ice sheets and planetary waves are enhanced ; nevertheless PMIP results using the Peltier´s ice sheets do not clearly exhibit a splitting of the jet stream (Valdes, this volume), strongly emphasized in previous runs (COHMAP-Members, 1988). Baroclinicity is also increased as a result of stronger meridional temperature gradients and storm tracks experience an eastward shift especially over the North Atlantic (Kageyama, et al., 1999). These circulation changes play a key role in determining regional climate change patterns. A detailed model-data comparison has only been done so far over Eurasia (see Kageyama et al., this volume). It shows that models are able to reproduce the main trends except over western Europe where they strongly underestimate the intensity of the winter cooling deduced from pollen data (Peyron, et al., 1998), thus underestimating the meridional temperature gradient over Africa-Europe.
(Pollard, in press) has analysed the simulated ice balance over the ice sheets as simulated by PMIP models. Indeed, ice sheet mass balance can be viewed as another test of model´s response to LGM forcing. Since the global ice volume reached a maximum around 21,000 years ago, one would expect that net surface budgets of the Laurentide and Eurasian ice sheets should have been close to zero. Three of the models have close to zero or positive net budgets whereas all the other simulations produce negative budgets, the deficit being particularly large with CLIMAP SST forcing and coarser resolution models. Over Greenland, (Krinner, et al., in press) and Krinner et al., (this volume) have used PMIP output to help in the interpretation of ice core proxy data such as air content and water isotopes.
A set of complementary experiments has been performed both by PMIP participating groups and other modeling groups that help to isolate and quantify the roles of ocean and land surface feedbacks as well as boundary conditions in determining climate.
Recent estimates of the LGM sea surface temperatures over the North Atlantic indicate warmer conditions than CLIMAP. Sensitivity experiments with two PMIP models show that forcing the models with these new estimates further increases the model-data discrepancy over the Mediterranean Basin (Pinot, et al., 1999).
Ocean dynamic changes may be important at the LGM as emphasized by models of intermediate complexity (Ganopolski, et al., 1998; Weaver, et al., 1998) which show a reduction of the thermohaline circulation. Fully coupled atmosphere-ocean models should be used in the future to examine this possibility. Up to now, only one transient run has been performed (Bush and Philander, 1998) and new results are discussed by Kitoh (this volume).
Vegetation feedbacks may also be important. These feedbacks involve climate-induced shifts in biomes, CO2-induced changes in vegetation structure, and CO2-induced changes in leaf conductance. Changes in vegetation may have contributed to the observed cooling over Europe (Crowley and Baum, 1997; Kubatzki and Claussen, 1998; Levis, et al., in press). In the tropics though, there is currently no indication of systematic improvements of the simulated cooling, since the models find large areas of warming due to the simulated deforestation, which appears to degrade the correspondence with observations.
PMIP is now coming close to the end of its first phase. Most analyses within subprojects have been completed or should be finished by the end of the year 2000. It was decided at the workshop that the PMIP database is now sufficiently mature to be opened for examination by the wider paleoclimate data community, which should enhance its value.
With the completion of the first set of PMIP experiments, some challenging questions still remain that deserve further investigations. In the coming years, there are groups planning simulations with coupled atmosphere-ocean-vegetation models, in order to study observed patterns of monsoon changes, observed changes over the Mediterranean basin, as well as the amplitude of the tropical cooling at the LGM and over western Europe. PMIP has also evolved from its origins which focused on its basic experiments : PMIP now involves a group of scientists committed to sharing their experiment results and knowledge for some key periods. PMIP has also demonstrated that comparisons of model results are particularly valuable in determining which model predictions are robust and might be worth focusing on in subsequent research.
Bard, E., B. Hamelin, R. G. Fairbanks and A. Zindler, 1990: Calibration of the 14C timescale over the past 30,000 years using mass spectrometric U-Th ages from Barbados corals. Nature, 345, 405-410.
Berger, A., 1978: Long-term variation of daily insolation and Quaternary climatic changes. Journal of Atmospheric Science, 35, 2362-2367.
Braconnot, P., S. Joussaume, N. de Noblet, G. Ramstein and PMIP-participating-groups, subm.: Mid-Holocene and last glacial maximum African monsoon changes as simulated within the Paleoclimate Modeling Intercomparison project. Global and Planetary Change.
Braconnot, P., S. Joussaume, O. Marti and N. de Noblet, 1999: Synergistic feedbacks from ocean and vegetation on the African monsoon response to mid-Holocene insolation. Geophysical Research Letters, 26, 2481-2484.
Braconnot, P., O. Marti, S. Joussaume and Y. Leclainche, in press: Ocean feedback in response to 6 kyr BP insolation. Journal of Climate.
Brostrom, A., M. Coe, S. P. Harrison, R. Gallimore, J. E. Kutzbach, J. Foley, I. C. Prentice and P. Behling, 1998: Land Surface feedbacks and palaeomonsoons in Northern Africa. Geophysical Research Letters, 25, 3615-3618.
Bush, A. B. G. and G. H. Philander, 1998: The role of ocean-atmosphere interactions in tropical cooling during the Last Glacial Maximum. Science, 279, 1341-1344.
Cheddadi, R., G. Yu, J. Guiot, S. P. Harrison and C. I. Prentice, 1997: The climate of Europe 6000 years ago. Climate Dynamics, 13, 1-9.
Claussen, M. and V. Gayler, 1997: The greening of Sahara during the mid-Holocene: results of an interactive atmosphere-biome model. Global Ecol Biogeography Letters, 6, 369-377.
CLIMAP, 1981: Seasonal reconstructions of the Earth´s surface at the last glacial maximum. Map Series, Technical Report MC-36, geological Society of America, Boulder, Colorado.
COHMAP-Members, 1988: Climatic changes of the last 18,000 years: observations and model simulations. Science, 241, 1043-1052.
Crowley, T. J. and S. K. Baum, 1997: Effect of vegetation on an ice-age climate model simulation. Journal of Geophysical Research (Atmosphere), 102, 16463-16480.
Dong, B. and P. J. Valdes, 1998: Simulations of the last glacial maximum climate using a general circulation model: prescribed versus computed sea surface temperatures. Climate Dynamics, 14, 571-591.
Dong, B., P. J. Valdes and N. M. J. Hall, 1996: The changes of monsoonal climates due to Earth´s orbital perturbations and ice age boundary conditions. Paleoclimates -data and modelling, 1, 203-240.
Duplessy, J. C., N. J. Shackleton, R. G. Fairbanks, L. Labeyrie, D. Oppo and N. Kallel, 1988: Deep water source variation during the last climatic cycle and their impact on the global deep water circulation. Paleoceanography, 3, 343-360.
Farreira, I., S. P. Harrison, I. C. Prentice, G. Ramstein, J. Guiot, P. J. Bartlein, R. Bonnefille, M. Bush, W. Cramer, U. von Grafenstein, K. Holmgren, H. Hooghiemstra, G. Hope, D. Jolly, S.-E. Lauritzen, Y. Ono, S. Pinot, M. Stute and G. Yu, 1999: Tropical climates at the last glacial maximum: a new synthesis of terrestrial palaeoclimate data. I. Vegetation, lake- levels and geochemistry. Climate Dynamics, 15, 823-856.
Ganopolski, A., C. Kubatzki, M. Claussen, V. Brovkin and V. Petoukhov, 1998: The influence of vegetation-atmosphere-ocean interaction on climate during the mid-Holocene. Science, 280, 1916-1919.
Ganopolski, A., S. Rahmstorf, V. Petoukhov and M. Claussen, 1998: Simulation of modern and glacial climates with a coupled global model of intermediate complexity. Nature, 391, 351- 356.
Guiot, J., J. J. Boreux, P. Braconnot, F. Torre and PMIP-participating-groups, in press: Data- models comparison using fuzzy logic in palaeoclimatology. Climate Dynamics, Hall, N. M. and P. J. Valdes, 1997: A GCM simulation of the climate 6000 years ago. Journal of Climate, 10, 3-17.
Harrison, S. P., D. Jolly, F. Laarif, A. Abe-Ouchi, B. Dong, K. Herterich, C. Hewitt, S. Joussaume, J. E. Kutzbach, J. Mitchell, N. de Noblet and P. Valdes, 1998: Intercomparison of simulated global vegetation distributions in response to 6 kyr BP orbital forcing. Journal of Climate, 11, 2721-2742.
Hewitt, C. D. and J. F. B. Mitchell, 1996: GCM simulations of the climate of 6kyr BP: mean changes and changes and interdecadal variability. Journal of Climate, 9, 3505-3529.
Hewitt, C. D. and J. F. B. Mitchell, 1998: A fully coupled GCM simulation of the climate of the mid-Holocene. Geophysical Research Letters, 25, 361-364.
IPCC, 1996: Climate Change 1995, The science of climate change. Cambridge University Press, 572 pp.
Jolly, D., I. C. Prentice, R. Bonnefille, A. Ballouche, M. Bengo, P. Brenac, G. Buchet, D. Burney, J.-P. Cazet, R. Cheddadi, T. Edorh, H. Elenga, S. Elmoutaki, J. Guiot, F. Laarif, H. Lamb, A.-M. Lezine, J. Maley, M. Mbenza, O. Peyron, M. Reille, I. Reynaud-Ferrera, G. Riollet, J. C. Ritchie, E. Roche, L. Scott, I. Ssemmanda, H. Straka, M. Umer, E. Van Campo, S. Vilimumbala, A. Vincens and M. Waller, 1998: Biome reconstruction from pollen and plant macrofossil data for Africa and the Arabian peninsula at 0 and 6 ka. Journal of Biogeography.
Joussaume, S., 1999: Modeling extreme climates of the past 20,000 years with general circulation models. Modeling the Earth´s climate and its variability. W. R. Holland, S. Joussaume and F. David, Eds., Les Houches, session LXVII, Elsevier, 527-565.
Joussaume, S. and P. Braconnot, 1997: Sensitivity of paleoclimate simulation results to season definitions. Journal of Geophysical Research (Atmosphere), 102, 1943-1956.
Joussaume, S., K. E. Taylor , P. Braconnot, J. F. B. Mitchell, J. E. Kutzbach, S. P. Harrison, I. C. Prentice, A. J. Broccoli, A. Abe-Ouchi, P. J. Bartlein, C. Bonfils, B. Dong, J. Guiot, K. Herterich, C. D. Hewitt, D. Jolly, J. W. Kim, A. Kislov, A. Kitoh, M. F. Loutre, V. Masson, B. McAvaney, N. McFarlane, N. de Noblet, W. R. Peltier, J. Y. Peterschmitt, D. Pollard, D. Rind, J. F. Royer, M. E. Schlesinger, J. Syktus, S. Thompson, P. Valdes, G. Vettoretti, R. S. Webb and U. Wyputta, 1999: Monsoon changes for 6000 years ago: results of 18 simulations from the Paleoclimate Modeling Intercomparison Project (PMIP). Geophysical Research Letters, 26, 859-862.
Joussaume, S. and K. E. Taylor, 1995: Status of the Paleoclimate Modeling Intercomparison Project (PMIP). Proceedings of the first international AMIP scientific conference. WCRP Report, 425-430.
Kageyama, M., P. J. Valdes, G. Ramstein, C. Hewitt and U. Wyputta, 1999: Northern hemisphere storm-tracks in present day and last glacial maximum climate simulations: a comparison of the European PMIP models. Journal of Climate, 12, 742-760.
Koc Karpuz, N. and H. Schrader, 1990: Surface sediment distribution and Holocene paleotemperature variations in the Greenland, Iceland and Norwegian Sea. Paleoceanography, 5, 557-580.
Kohfeld, K. E. and S. P. Harrison, in press: How well can we simulate past climates ? Evaluating the models using global palaeoenvironmental datasets. Quaternary Science Reviews.
Krinner, G., D. Raynaud and H. Dang, in press: Simulations of past ice sheet surface climates: implications for the interpretation of ice core data. Journal of Geophysical Research (Atmosphere).
Kubatzki, C. and M. Claussen, 1998: Simulation of the global bio-geophysical interactions during the last glacial maximum. Climate Dynamics, 14, 461-471.
Kutzbach, J. E., G. Bonan, J. Foley and S. Harrison , 1996: Vegetation and soil feedbacks on the response of the African monsoon to forcing in the early to middle Holocene. Nature, 384, 623-626.
Kutzbach, J. E. and Z. Liu, 1997: Response of the African monsoon to orbital forcing and ocean feedbacks in the Middle Holocene. Science, 278, 440-443.
Levis, S., J. A. Foley and D. Pollard, in press: Climate-vegetation feedbacks at the Last Glacial Maximum. Journal of Geophysical Research (Atmosphere).
Lorenz, S., B. Grieger, P. Helbig and K. Herterich, 1996: Investigating the sensitivity of the atmospheric general circulation model ECHAM3 to paleoclimatic boundary conditions. Geol Rundsch, 85, 513-524.
Masson, V., R. Cheddadi, P. Braconnot, S. Joussaume, S. Texier and PMIP-participating-groups, 1999: Mid-Holocene climate in Europe:what can we infer from PMIP model-data comparisons ? Climate Dynamics, 15, 163-182. Masson, V. and S. Joussaume, 1997: Energetics of the 6000 BP atmospheric circulation in boreal summer, from large scale to monsoon areas : a study with two versions of the LMD AGCM. Journal of Climate, 10, 2888-2903.
Masson, V., S. Joussaume, S. Pinot and G. Ramstein, 1998: Impact of parameterizations on simulated winter mid-Holocene and Last Glacial Maximum climatic changes in the Northern Hemisphere. Journal of Geophysical Research (Atmosphere), 103, 8935-8946.
de Noblet, N., M. Claussen and C. Prentice, in press: Mid-Holocene greening of the Sahara: first results of the GAIM 6000 yr BP experiment with two asynchronously coupled atmosphere/biome models. Climate Dynamics.
Otto-Bliesner, B. L., 1999: El Nino/La Nina and Sahel precipitation during the middle Holocene. Geophysical Research Letters, 26, 87-90.
Peltier, R. W., 1994: Ice age paleotopography. Science, 265, 195-201.
Peyron, O., J. Guiot, R. Cheddadi, P. Tarasov, M. Reille, J. L. de Beaulieu, S. Bottema and V. Andrieu, 1998: Climatic reconstruction in Europe for 18,000 years B.P. from pollen data. Quaternary Research, 49, 183-196.
Pinot, S., G. Ramstein, S. P. Harrison, I. C. Prentice, J. Guiot, M. Stute, S. Joussaume and PMIP- participating-groups, 1999: Tropical paleoclimates at the Last Glacial Maximum: comparison of Paleoclimate Modeling Intercomparison Project (PMIP) simulations and paleodata. Climate Dynamics, 15, 857-874.
Pinot, S., G. Ramstein, I. Marsiat, A. de Vernal, O. Peyron, J. C. Duplessy and M. Weinelt, 1999: Sensitivity of the European LGM climate to North Atlantic sea-surface temperature. Geophysical Research Letters, 26, 1893-1896.
Pollard, D., in press: Comparisons of ice-sheet surface mass budgets from PMIP simulations. Global and Planetary Change.
Raynaud, D., J. Jouzel, J.-M. Barnola , J. Chappelaz, R. Delmas and C. Lorius, 1993: The ice record of greenhouse gases. Science, 259, 926-934.
Rind, D. and D. Peteet, 1985: Terrestrial conditions at the Last Glacial Maximum and CLIMAP sea-surface temperature estimates : Are they consistent ? Quaternary Research, 24, 1-22.
Ruddiman, W. F. and A. C. Mix, 1993: The north and equatorial Atlantic at 9000 and 6000 yr BP. Global climates since the Last Glacial Maximum. H. E. J. Wright, J. E. Kutzbach, T. Webb III, W. F. Ruddiman, F. A. Street-Perrott and P. J. Bartlein, Eds., University of Minnesota Press, 94-124.
Texier, D., N. de Noblet and P. Braconnot, in press: Sensitivity of the African and Asian monsoons to mid-Holocene insolation and data-inferred surface changes. Journal of Climate.
Texier, D., N. de Noblet, S. P. Harrison, A. Haxeltine, D. Jolly, S. Joussaume, F. Laarif, I. C. Prentice and P. Tarasov, 1997: Quantifying the role of biosphere-atmosphere feedbacks in climate change: coupled model simulations for 6000 years BP and comparison with paleodata for northern Eurasia and northern Africa. Climate Dynamics, 13, 865-882.
Vavrus, S. J., 1999: The response of the coupled arctic sea ice-atmosphere system to orbital forcing and ice motion at 6 kyr and 115 kyr BP. Journal of Climate, 12, 873-896.
Weaver, A. J., M. Eby, A. F. Fanning and E. C. Wiebe, 1998: Simulated influence of carbon dioxyde, orebital forcing and ice sheets on the climate of the Last Glacial Maximum. Nature, 394, 847-853.
Yu, G. and S. P. Harrison, 1996: An evaluation of the simulated water balance of northern Eurasia at 6000 yr B.P. using lake status data. Climate Dynamics, 12, 723-735.